A scatter plot of every bar in Wisconsin (there are a lot of them).
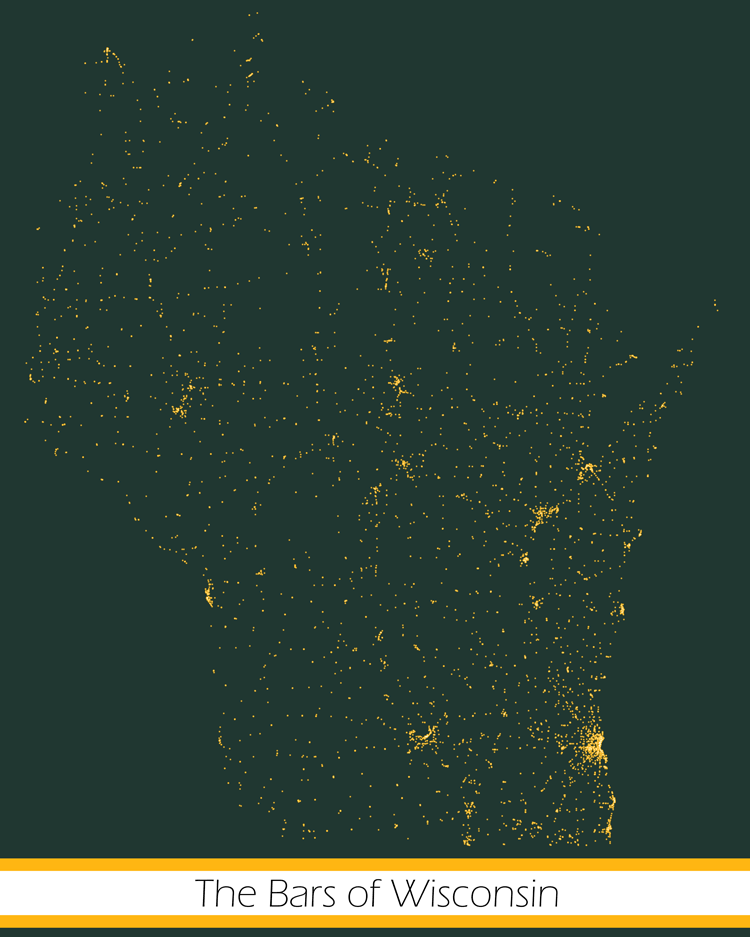
I know, I know... it's a population map, but anyone that has been to Wisconsin knows this is an apt way to describe the population of Wisconsin.
A blog has to start somewhere. In the future, I'll hope to show interesting, provocative, or educational data analyses, but for now, this is just a recent fun project. My goal was to make something similar to this map of UK bars. In this post, I'll walk you through the steps I took to make this.
Data Sourcing
To get a list of bars and their coordinates, I eventually landed on collecting the information from yellowpages.com. The search results seemed to be more complete than other options like the Yelp API. I was okay with the occasional missing or inaccurate entry, and lacking an "official" list of bars in Wisconsin, this approach would have to suffice.
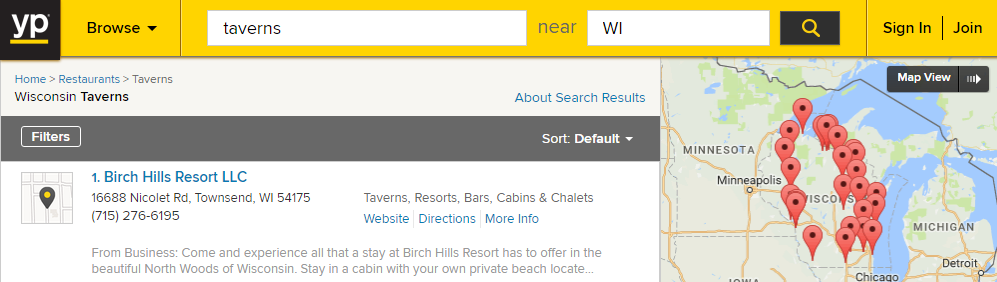
A simple search of "taverns" and "Wisconsin" returned about 6,300 results, so it seemed like I'd have a good list. Unfortunately, the first roadblock came when every page after 100 simply displayed the results from page 100. I guess broad searches are only tolerated up to a point. The search area needed to be smaller, so I decided to take a systematic approach and go by ZIP code. Of course this introduced duplicate results, but those were easily removed later.
Retrieving the latitude and longitude took some digging, but the information was there in the HTML, sent to Google to create the map you see above. I was able to pull the coordinates out of the javascript on the page.
The Code
The scraping was done in Python with Beautiful Soup.
import requests
import pandas as pd
from bs4 import BeautifulSoup
import json
import re
import time
import csv

# import a downloaded list of Wisconsin ZIP codes
zips = pd.read_csv('WI Zips.csv')['ZIP Code']

session = requests.session()
I had a couple helper functions. The biggest issue was extracting coordinates from the javascript, but that was reasonably straightforward.
def get_yp_url(zipcode, page):
    url = 'http://www.yellowpages.com/search?search_terms=taverns&geo_location_terms={}&page={}'
    return url.format(int(zipcode), page)

def get_coords_from_javascript(scripts):
    '''
    :param scripts: a list of javascript blocks from webpage
    :return: List of geographic coordinates
    '''

    locs=[] # List of locations to be returned

    # Regex to find the javascript with lat/long information
    pattern = re.compile(r'YPU = (.*?);')

    for script in scripts:
        if len(pattern.findall(str(script.string))) == 1:
            data = pattern.findall(str(script.string))
            down = json.loads(data[0])
            try:
                locs = down['expandedMapListings']
                if len(locs) ==0: break
            except:
                break
    return locs
The outer container for writing our data to csv:
writefile = 'Wisconsin_lat_long.csv'
with open(writefile, 'w') as f1:
    writer = csv.writer(f1, delimiter=',', lineterminator='\n')
And then I loop through each ZIP code, performing a search, and going through all of the result pages. Latitudes and longitudes were written to csv, and I added a time delay for slightly more responsible web scraping.
for zipcode in zips:
    for page in range(1,30):
        url = get_yp_url(zipcode, page)
        print(url)

        s = session.get(url)
        soup = BeautifulSoup(s.text, 'lxml')

        # Get all javascript blocks from page
        scripts = soup.findAll('script')

        locs = get_coords_from_javascript(scripts)

        if len(locs) == 0: break

        for loc in locs:
            writer.writerow([loc['name'],loc['zip'],loc['latitude'], loc['longitude']])
            print(loc['name'],loc['zip'],loc['latitude'], loc['longitude'])

        print('{}-------------{}'.format(zipcode, page))
        time.sleep(2)
This wasn't an efficient way to get the data by any means, but it worked well enough.
Data Cleaning and Plotting
Now that I had a csv with geographic information, there were only a couple more steps. The data had plenty of missing values and duplicates, which needed to be removed:
| Name | ZIP | Latitude | Longitude | |
|---|---|---|---|---|
| Lynn's Creekside Bar & Grill | 53001 | 43.59045 | -88.050026 | |
| Times Remembered Inc | 53001 | 43.615665 | -87.952675 | |
| The Whey Side Saloon Hall & Charcoal Grill | 53001 | 43.61909 | -87.952675 | |
| Greg's Tap | 53001 | 43.618343 | -87.951965 | |
| Grandma & Grandpa's | 53001 | |||
| Lake House Sports Pub & Gril | 53073 | |||
| Nap's Place | 53073 | |||
| Laack's Tavern & Ballroom | 53085 | |||
| Racers Hall | 53073 | |||
| Harbor Lights Resort Pub | 53011 | 43.64997 | -88.009674 | |
| BENN THERE PUB | 53011 | 43.65839 | -88.006744 | |
| Sipp's Bar and Grill | 53011 | 43.65839 | -88.006744 |
I also filtered the results by legitimate Wisconsin ZIP codes, since some sneaky bars in Minnesota and Illinois were trying to get in.
import matplotlib.pyplot as plt
import numpy as np
import pandas as pd

df = (pd.read_csv('Wisconsin_lat_long.csv',
                 delimiter = ",",
                 encoding="windows-1252",
                 header=None,
                 names=['Name', 'Zip','Lat', 'Long'])
       .drop_duplicates()
       .dropna()
       .query('Zip>53000 & Zip<55000'))
Once the data was clean, I fiddled with plotting for quite a while before I had something I was happy with. I had a few requirements:
- The colors needed to be green and gold (naturally)
- I wanted a gradient effect for each point
- I wanted the rural taverns to be visible without the urban areas becoming over-saturated messes.
I ended up "cheating" to get the gradient by plotting multiple times with different transparencies and point sizes. Here's the detail when you zoom in on Madison, WI, you can see the gradient effect as well as the isthmus between lakes Mendota and Menona.
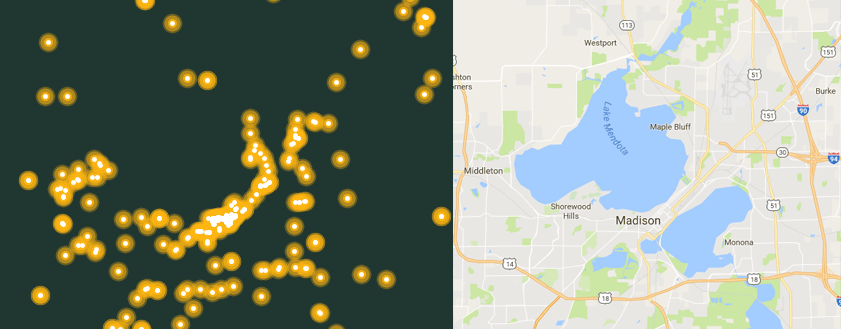 Detailed view of the bars in Madison, Wisconsin
The plotting was done with the following commands:
green = r'#203731'
gold = r'#FFB612'

plt.figure(figsize=(120,120))
plt.subplot('111', axisbg = green)

plt.scatter(df.Long, df.Lat, alpha=3/10, lw=0, edgecolors=None, s=200, color=gold, marker="o")
plt.scatter(df.Long, df.Lat, alpha=5/10, lw=0, edgecolors=None, s=135, color=gold, marker="o")
plt.scatter(df.Long, df.Lat, alpha=7/10, lw=0, edgecolors=None, s=45, color=gold, marker="o")
plt.scatter(df.Long, df.Lat, alpha=9/10, lw=0, edgecolors=None, s=20, color=gold, marker="o")
plt.scatter(df.Long, df.Lat, alpha=10/10, lw=0, edgecolors=None, s=12, color=r'#FFFFFF', marker="o")

plt.xlim([-94,-86])
plt.ylim([42,47])

plt.show()
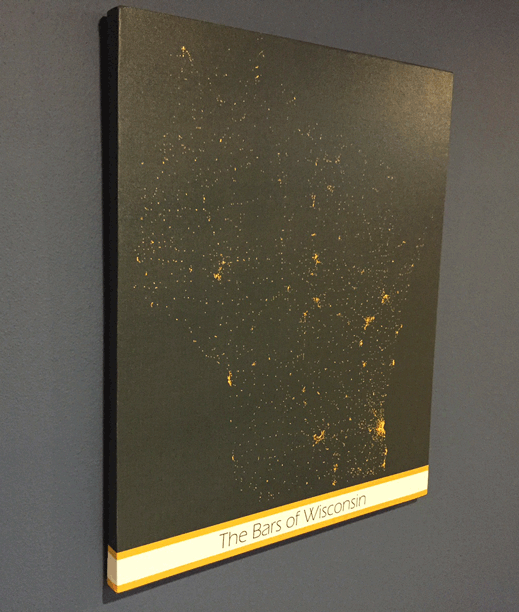
And there we have it:
For the finishing touches I added a simple banner in Photoshop. I think it turned out well, and I think it will look great on canvas, probably in my basement. The print is on order as I post this! I'm certain that not every state would be recognizable from a map of its bars.
Next steps:
-
Get this printed and on my wall.
-
Create the ultimate Wisconsin pub crawl as a travelling salesman problem. I say that in jest. There might be a few too many points to make it computationally feasible.
-
More data posts.
UPDATE: I think this really ties the room together :)
Thanks for reading.
The code is available here.
Comments